BRCA Heatmap
import CanDI.candi as can
import pandas as pd
import numpy as np
import matplotlib.pyplot as plt
from mpl_toolkits.axes_grid1 import make_axes_locatable
Cancer Object Instantiation
We’re interested in cross referencing some data in breast and ovarian cancer so instantiate cancer objects as follows. To double check the object instantiation I check the length of the depmap_id vectors. This lets me know we’re able to index other datasets correctly
ov = can.Cancer("Ovarian Cancer")
br = can.Cancer("Breast Cancer")

#Number of Ovarian Cell lines
print(len(ov.depmap_ids))
#Number of Breast Cell Lines
print(len(br.depmap_ids))
74
83
Subsetting by mutation status
Explicitly load mutations into memory.This only needs to be done once You will be done prompted to load a given dataset if using operations that act on that dataset and it is not in memory.
can.data.load("mutations")
| gene | Entrez_Gene_Id | NCBI_Build | Chromosome | Start_position | End_position | Strand | Variant_Classification | Variant_Type | Reference_Allele | ... | isCOSMIChotspot | COSMIChsCnt | ExAC_AF | Variant_annotation | CGA_WES_AC | HC_AC | RD_AC | RNAseq_AC | SangerWES_AC | WGS_AC | |
|---|---|---|---|---|---|---|---|---|---|---|---|---|---|---|---|---|---|---|---|---|---|
| 0 | VPS13D | 55187 | 37 | 1 | 12359347 | 12359347 | + | Nonsense_Mutation | SNP | C | ... | False | 0.0 | NaN | damaging | 34:213 | NaN | NaN | NaN | 34:221 | NaN |
| 1 | AADACL4 | 343066 | 37 | 1 | 12726308 | 12726322 | + | In_Frame_Del | DEL | CTGGCGTGACGCCAT | ... | False | 3.0 | NaN | other non-conserving | 57:141 | NaN | NaN | NaN | 9:0 | 28:32 |
| 2 | IFNLR1 | 163702 | 37 | 1 | 24484172 | 24484172 | + | Silent | SNP | G | ... | False | 0.0 | NaN | silent | 118:0 | NaN | NaN | 10:0 | 118:0 | 18:0 |
| 3 | TMEM57 | 55219 | 37 | 1 | 25785018 | 25785019 | + | Frame_Shift_Ins | INS | - | ... | False | 0.0 | NaN | damaging | NaN | NaN | NaN | 6:28 | NaN | NaN |
| 4 | ZSCAN20 | 7579 | 37 | 1 | 33954141 | 33954141 | + | Missense_Mutation | SNP | T | ... | False | 0.0 | NaN | other non-conserving | 28:62 | NaN | NaN | NaN | 27:61 | NaN |
| ... | ... | ... | ... | ... | ... | ... | ... | ... | ... | ... | ... | ... | ... | ... | ... | ... | ... | ... | ... | ... | ... |
| 1230240 | SLC39A4 | 55630 | 37 | 8 | 145641991 | 145641991 | + | Silent | SNP | C | ... | False | 0.0 | 0.000017 | silent | 52:23 | NaN | NaN | NaN | NaN | NaN |
| 1230241 | TAL2 | 6887 | 37 | 9 | 108424778 | 108424778 | + | Start_Codon_SNP | SNP | A | ... | False | 0.0 | NaN | damaging | 27:0 | NaN | NaN | NaN | NaN | NaN |
| 1230242 | TRO | 7216 | 37 | X | 54955098 | 54955098 | + | Silent | SNP | C | ... | False | 0.0 | NaN | silent | 5:16 | NaN | NaN | NaN | NaN | NaN |
| 1230243 | USP51 | 158880 | 37 | X | 55514703 | 55514703 | + | Missense_Mutation | SNP | G | ... | False | 0.0 | NaN | other non-conserving | 23:0 | NaN | NaN | NaN | NaN | NaN |
| 1230244 | C1GALT1C1 | 29071 | 37 | X | 119760406 | 119760406 | + | Missense_Mutation | SNP | T | ... | False | 0.0 | NaN | other non-conserving | 28:0 | NaN | NaN | NaN | NaN | NaN |
1230245 rows × 32 columns
I want to look at BRCA1 mutations in these types of cancers. I start by using the mutated function to identify ovarian and breast cancer cell lines with BRCA1 mutations. A cancer object’s mutated method’s default behavior is to output a list of depmap ids corresponding to celllines containing any mutation within the given genes. I then instantiate CellLineCluster objects of exclusively mutated or wild type cell lines for both breast and ovarian cancer. This makes comparing these cell lines easier.
ov_mt_list = ov.mutated(["BRCA1"]) #List of depmap_ids
br_mt_list = br.mutated(["BRCA1"]) #list of depmap_ids

ov_mt = can.CellLineCluster(ov_mt_list) #CellLineCluster obj
br_mt = can.CellLineCluster(br_mt_list)


print("Depmap_ids attribute should be the same as the list used to instantiate the CellLineCluster object\n")
print(ov_mt.depmap_ids == ov_mt_list)

#CellLineCluster ojbect must be instantiated with a mutable sequence
#I use set operations to get wild type cell line ids and convert to a list
ov_wt_list = list(set(ov.depmap_ids) - set(ov_mt_list))
br_wt_list = list(set(br.depmap_ids) - set(br_mt_list))

ov_wt = can.CellLineCluster(ov_wt_list)
br_wt = can.CellLineCluster(br_wt_list)
print(ov_wt.depmap_ids == ov_wt_list)
Depmap_ids attribute should be the same as the list used to instantiate the CellLineCluster object

True
True
Cross Referencing Mutation and Gene Knockout Data
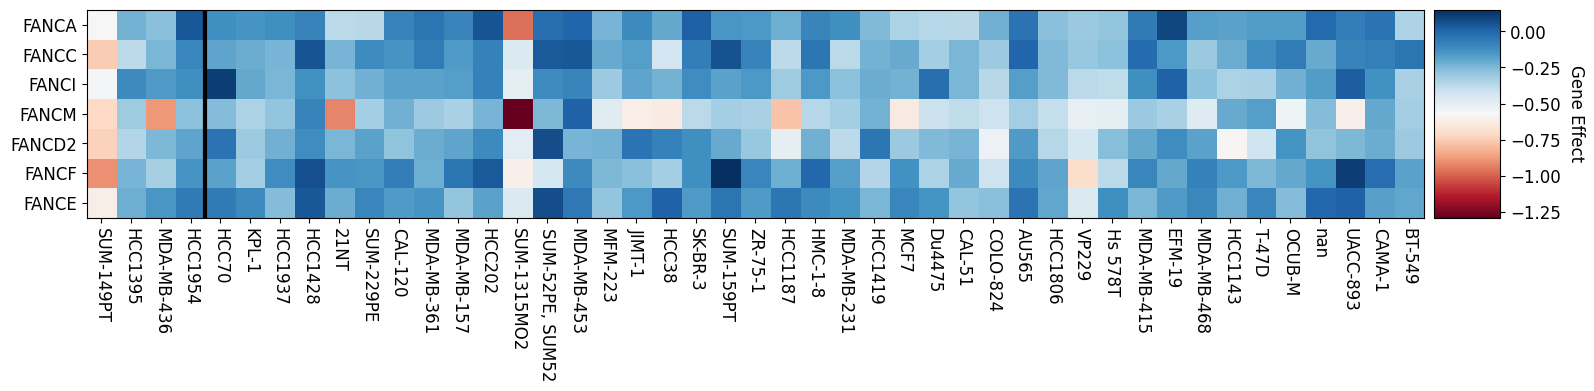
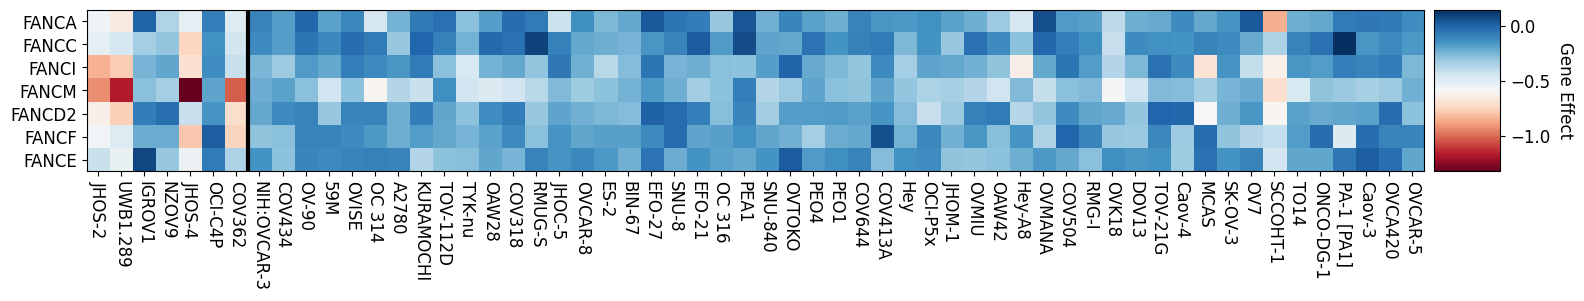
I’m interested in how the mutation status of BRCA1 effects a cancer’s dependency on the fanconi anemia genes. To visualize this relationship I am going to make a heatmap of fanconi anemia genes sorting the cell lines by their BRCA1 mutation status. The following cell defines a function that plots a heatmap of the gene effect of the fanconi anemia genes separating them by the BRCA1 mutation status of a given cell line.
def gene_effect_heatmap(obj1, obj2, genes, name = None):

    #Make Figure appropriate size, dpi, and font
    plt.rcParams.update({"figure.figsize": (16, 6),
                        "savefig.dpi": 300,
                        "font.size": 12
                        })

    #One figure with one subplot
    fig, ax = plt.subplots(1,1)

    #Construcat matrix to make heatmap and cell line labels
    data = pd.concat([obj1.effect_of(genes), obj2.effect_of(genes)], axis=1)
    names = can.data.cell_lines.loc[data.columns, "cell_line_name"]

    # We want to show all ticks...
    ax.set_xticks(np.arange(len(names)))
    ax.set_yticks(np.arange(len(genes)))
    # ... and label them with the respective list entries
    ax.set_xticklabels(names)
    ax.set_yticklabels(genes)

    #make heatmap
    im = ax.imshow(data, cmap="RdBu")

    #Make colorbar scale to axis
    divider = make_axes_locatable(ax)
    cax = divider.append_axes("right", size="5%", pad=0.1)
    cbar = ax.figure.colorbar(im, ax = ax, cax = cax)
    cbar.ax.set_ylabel("Gene Effect", rotation=-90, va="bottom")

    #Draw Dividing line btween mutant and
    ax.axvline(x=obj1.gene_effect.shape[1] - 0.5, c = "black", linewidth = 3)
    plt.setp(ax.get_xticklabels(), rotation=-90, ha="left", va="center",
         rotation_mode="anchor")
    plt.tight_layout()
    plt.show()

    if name:
        fig.savefig(name, dpi=300)
Fanconi Anemia Genes Knockout Effect in Ovarian Cancer
BRCA1 Mutant Left of Vertical Line
genes = ["FANC" + i for i in ["A", "C", "I", "M", "D2", "F", "E"]]
gene_effect_heatmap(ov_mt, ov_wt, genes, name = None)
Load Complete
Fanconi Anemia Genes Knockout Effect in Breast Cancer
BRCA1 Mutant Left of Vertical Line
gene_effect_heatmap(br_mt, br_wt, genes, name = None)